Complete example
Revolut
A stock-detail screen with a scrubbed price, line/candlestick switch, annotations, and a native tooltip view.
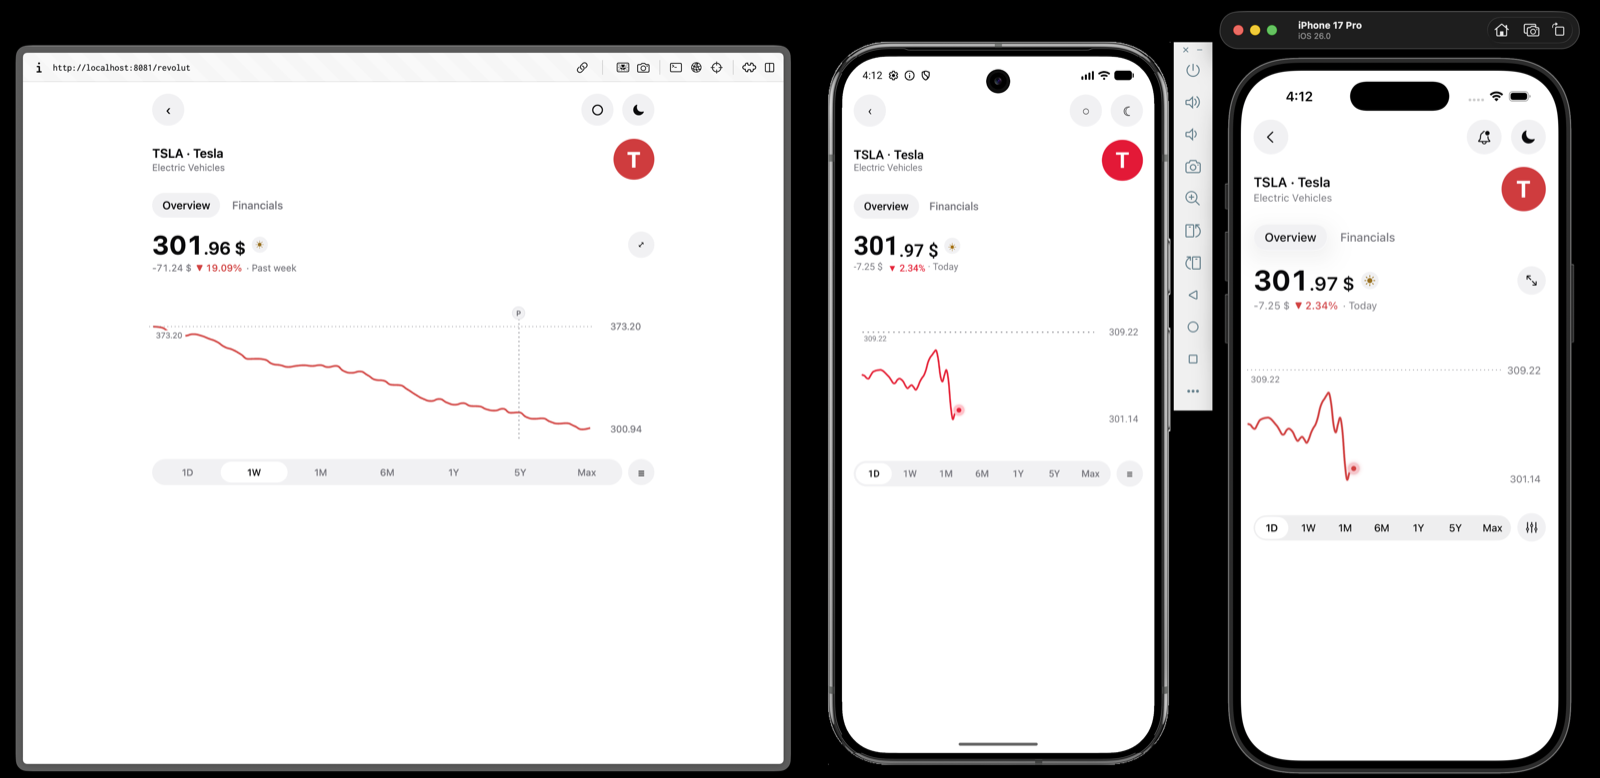
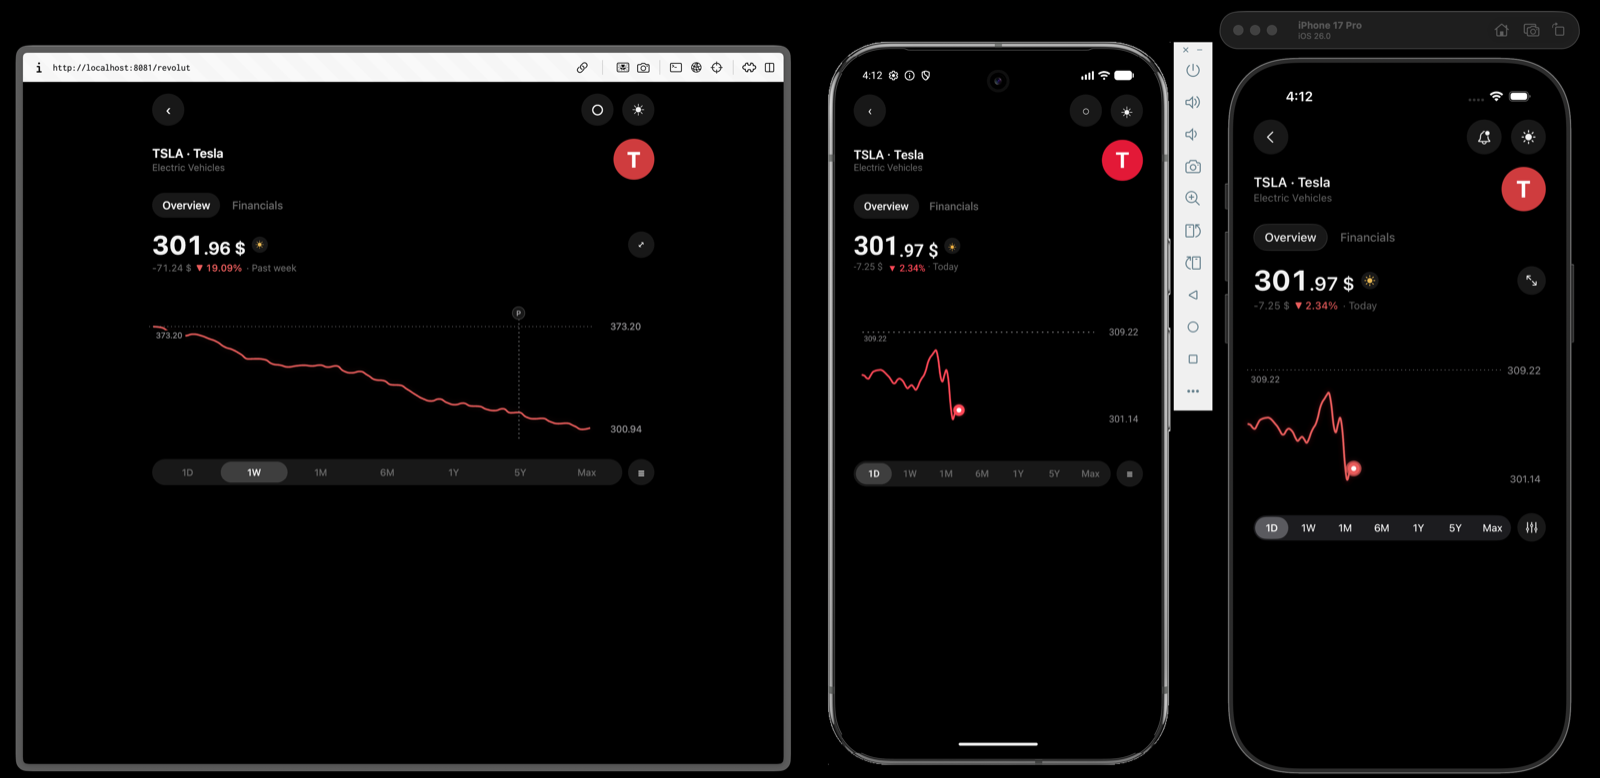
Uses Line, Candlestick, useChartScrub, annotations, reveal animation, and custom tooltip placement.
Build the chart
tsx
import { Chart, zyplot } from '@hzblj/zyplot'

const chart = zyplot(z => ({
  categories,
  series: [
    z.series({
      id: 'price',
      label: 'Price',
      values: prices,
      style: { color: '#0066ff', glow: z.glow({ opacity: 0.2, radius: 12 }), strokeWidth: 2.3 },
    }),
  ],
  animation: z.animation({ reveal: z.reveal.draw({ duration: 520 }) }),
  annotations: [
    z.annotation.point({ id: 'live', x: categories.at(-1), y: prices.at(-1), pulse: true }),
  ],
  interaction: z.interaction.scrub({ marker: z.marker.point({ size: 14 }) }),
  format: z.format({ decimals: 2, prefix: '$' }),
}))

export function PriceChart() {
  return <Chart.Line {...chart} />
}