App

Health

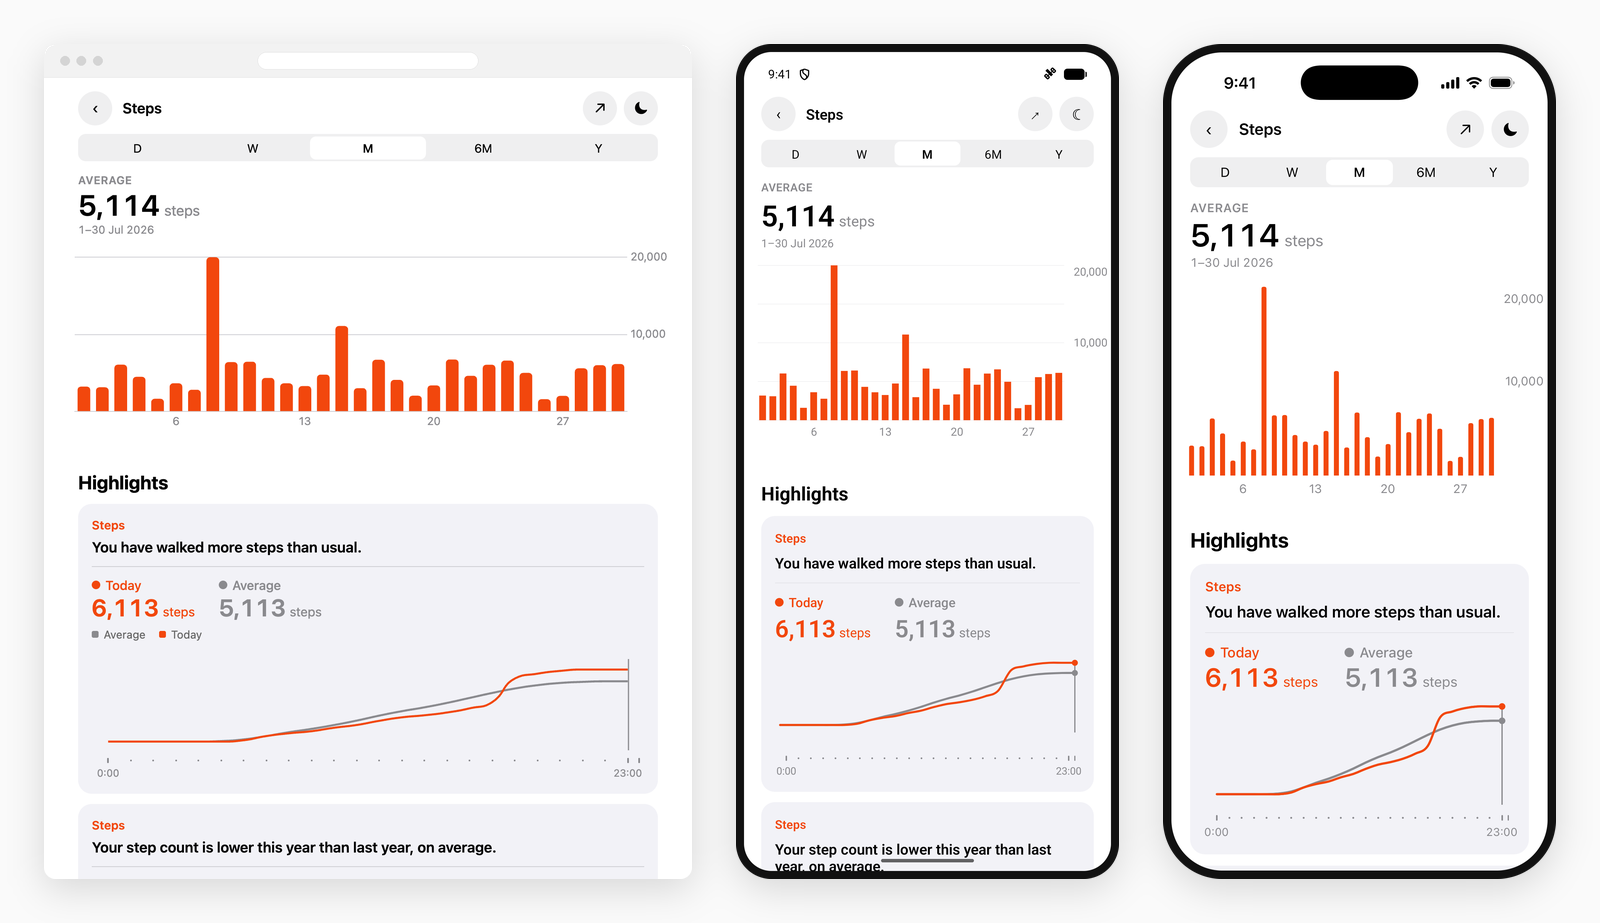
A steps screen in the shape Health's has: a bar per day under a headline that becomes a card when a finger lands, a window picker above it, and cards below that are charts in their own right. The three studies before this one are traces. This is the bar chart's turn, and a bar chart asks different questions — it has no direction to be drawn along, no pairs to morph between when the window changes, and a scale that would rather sit inside the plot than beside it.

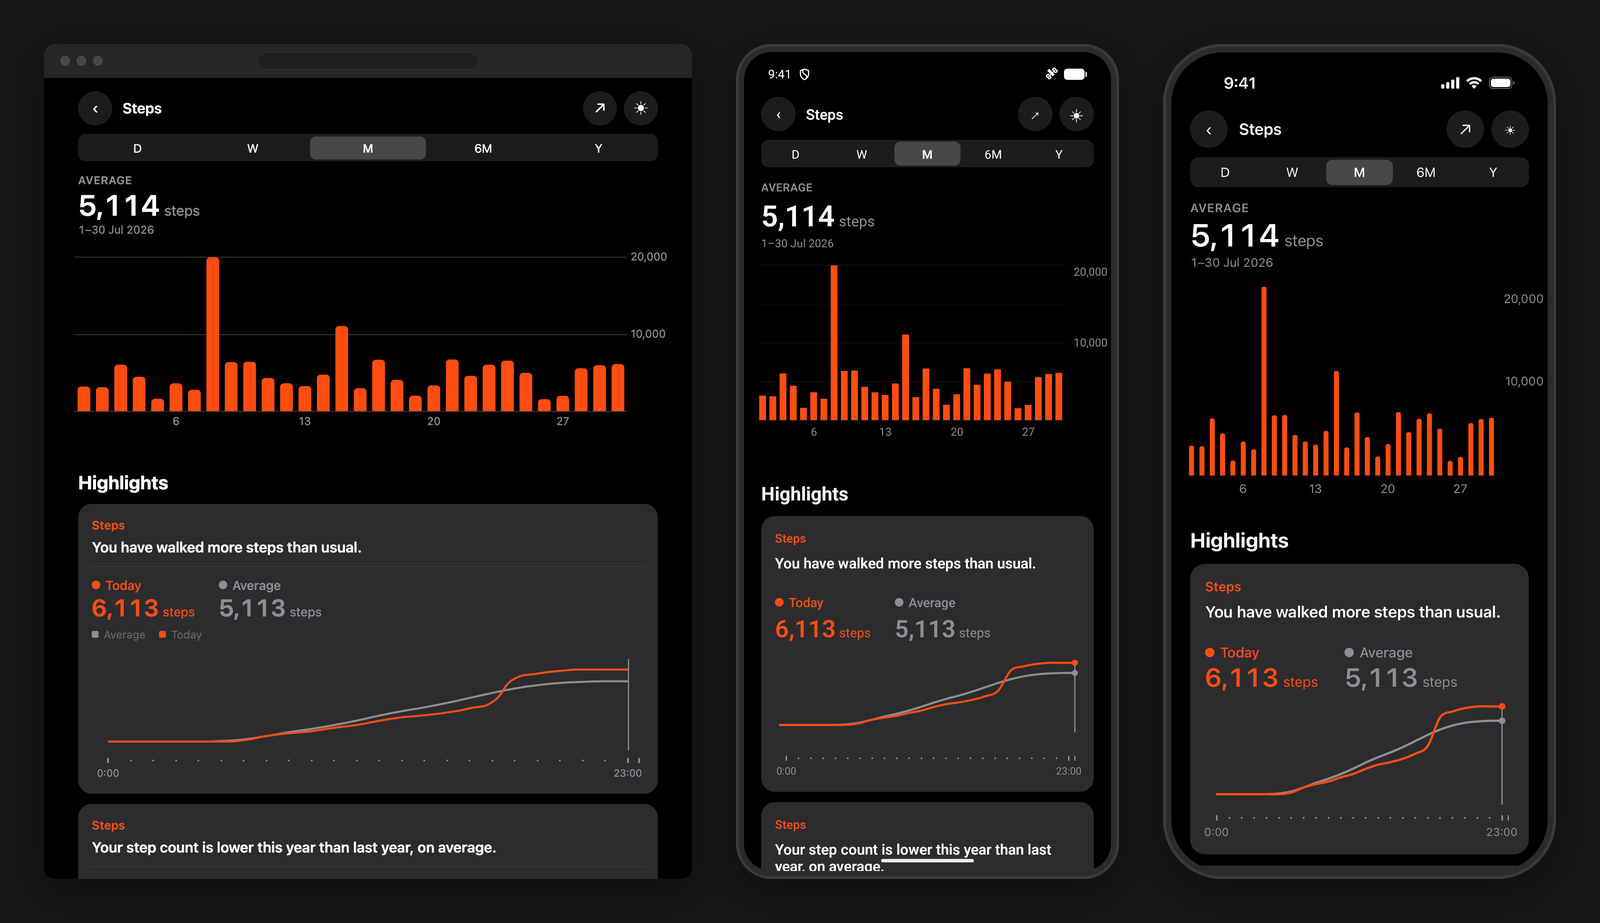
The Health-style steps screen running on the web, on Android and on iOS, side by side
One bar chart, three renderers, in the appearance you are reading this page in — two gridlines, the counts written inside the plot, and the dates named rather than left to the renderer.

The scale inside the plot

Two gridlines and nothing else, at round numbers above the tallest bar, with the counts written inside the plot against its trailing edge rather than in a gutter beside it. The reader is comparing bars with each other, so a third rule only adds ink — and an overlaid label reserves no gutter, which leaves the full width to the bars.

tsx
const stepsAxis = (range: StepsRange) => {
  // A round number above the tallest bar: 10 000 over a week of 8 400s.
  const tallest = Math.max(...range.values, 1)
  const step = Math.pow(10, Math.floor(Math.log10(tallest)))
  const top = Math.ceil(tallest / step) * step

  return axis.overlay({
    domain: { max: top, min: 0 },
    format: { decimals: 0, locale: 'en-US' },
    grid: true,
    // How far inside the trailing edge the counts sit.
    labelInset: 4,
    labelSize: 13,
    ticks: false,
    tickValues: [top / 2, top],
  })
}

The dates underneath are named for a different reason. Each renderer keeps a gap of its own under the label row — Swift Charts is the tightest of the three — so the row sat at a different distance on every platform until labelInset put all three on one number. The air at the ends of the plot is named too: the overlaid counts give the trailing edge room of its own, so an equal inset on the leading edge reads as less than one.

tsx
xAxis={{
  grid: false,
  labelInset: 6,
  // Room for the overlaid counts, and more before the first bar than after the last.
  plotDimensionEndPadding: 6,
  plotDimensionStartPadding: 16,
  ticks: false,
  // Which days are named — a month names four of thirty.
  tickValues: range.ticks,
}}
Bars grow, they do not trace. The arrival is a reveal.fade with no transition, so a window switch simply draws the new bars: thirty of them and seven have no pairs to morph between, and holding the outgoing set on screen to dissolve it reads as two charts at once rather than as one changing. No delay either — a window switch is a tap being answered, and the wait that suits a screen being pushed reads as a stall here.

Two fingers, one total

A day is worth reading on its own, and a week is a number the bars cannot be added up by eye. So the reading is both: one finger names a bar, two name everything between them, and the card over the plot totals whichever arrived. That is interaction.range, and it is a native gesture — a pointer has no second finger — so the web keeps the chart's own tooltip instead.

tsx
const reading = interaction({
  crosshair: 'x',
  // One style dresses the single rule and the pair at a span's ends alike.
  crosshairStyle: { color: color.rule, width: isAndroid ? 1.2 : 1 },
  haptics: true,
  range: true,
  // On the web Chart.Bar reports no scrub for a headline to follow, so the card stays the chart's.
  tooltip: isWeb,
})

Only ever one of the two is set, so the screen never has to work out which reading is newer. And a span already knows where both its ends landed, which is what lets the card sit over the middle of what is held rather than over one edge of it.

tsx
const { geometry, onInteraction, range: span, selection } = useChartScrub()

// One bar is a span of one, so the readout below has a single shape to total.
const held = span ?? (selection ? { endIndex: selection.index, startIndex: selection.index } : null)
const anchor = span ? (span.startX + span.endX) / 2 : (selection?.nativeX ?? null)

// Kept inside the plot the chart reported, so a card near an end squares up rather than hangs off.
const plot = geometry?.plot
const left = Math.min(Math.max(anchor - CARD_WIDTH / 2, plot.x), plot.x + plot.width - CARD_WIDTH)

What it uses

PropTypeDefaultDescription
Chart.Barfeature-charts/steps-chart.tsxThe bars: two gridlines at round numbers, the counts overlaid inside the plot, the dates named rather than left to the renderer, and a fade on arrival instead of a trace.
axis.overlayfeature-charts/steps-chart-style.tsPuts the counts inside the plot against its trailing edge and reserves no gutter, so the bars keep the full width. Works on the web as well as on native.
interaction.rangefeature-charts/steps-chart-style.tsTwo fingers report the marks under each of them and everything between, which is what the card totals. iOS and Android only.
plotDimensionStartPaddingfeature-charts/steps-chart-style.tsThe air before the first bar and after the last, named rather than left to each renderer, so the same gutter is kept on all three.
Chart.Linefeature-charts/steps-cumulative-chart.tsxThe highlight card underneath: the day so far against a usual day, smoothed, with no axes of its own, a floor below zero for air under the flat start, and clip off so the end dots sit astride the last reading.
useChartScrubapps/example/use-steps-view.tsTurns one finger or two into the headline card, and reports the plot box the card is kept inside.

Split the way the other studies are: the charts, their style, the theme and the generated counts are the shared packages/feature-charts package, and the screen around them is in the example app. This is the one study that is not one file per platform — its chrome is a segmented picker and a column of cards, which plain React Native draws the same on all three.

A study, not a product. The screen is built to test the library against a design people already know by heart. It uses generated data, and it is not affiliated with or endorsed by Apple.