App

Family

A token screen in the shape Family's has: a trace edge to edge with no axes, a price above it that follows the finger, and a window picker under it. Where the Revolut study is about the chrome around a plot and the Kraken one about the plot itself, this one is about time — nothing on the screen is allowed to cut. The data arrives as a morph, the reading is lit over a beat rather than at the touch, and both of those exist in the library because this screen asked for them.

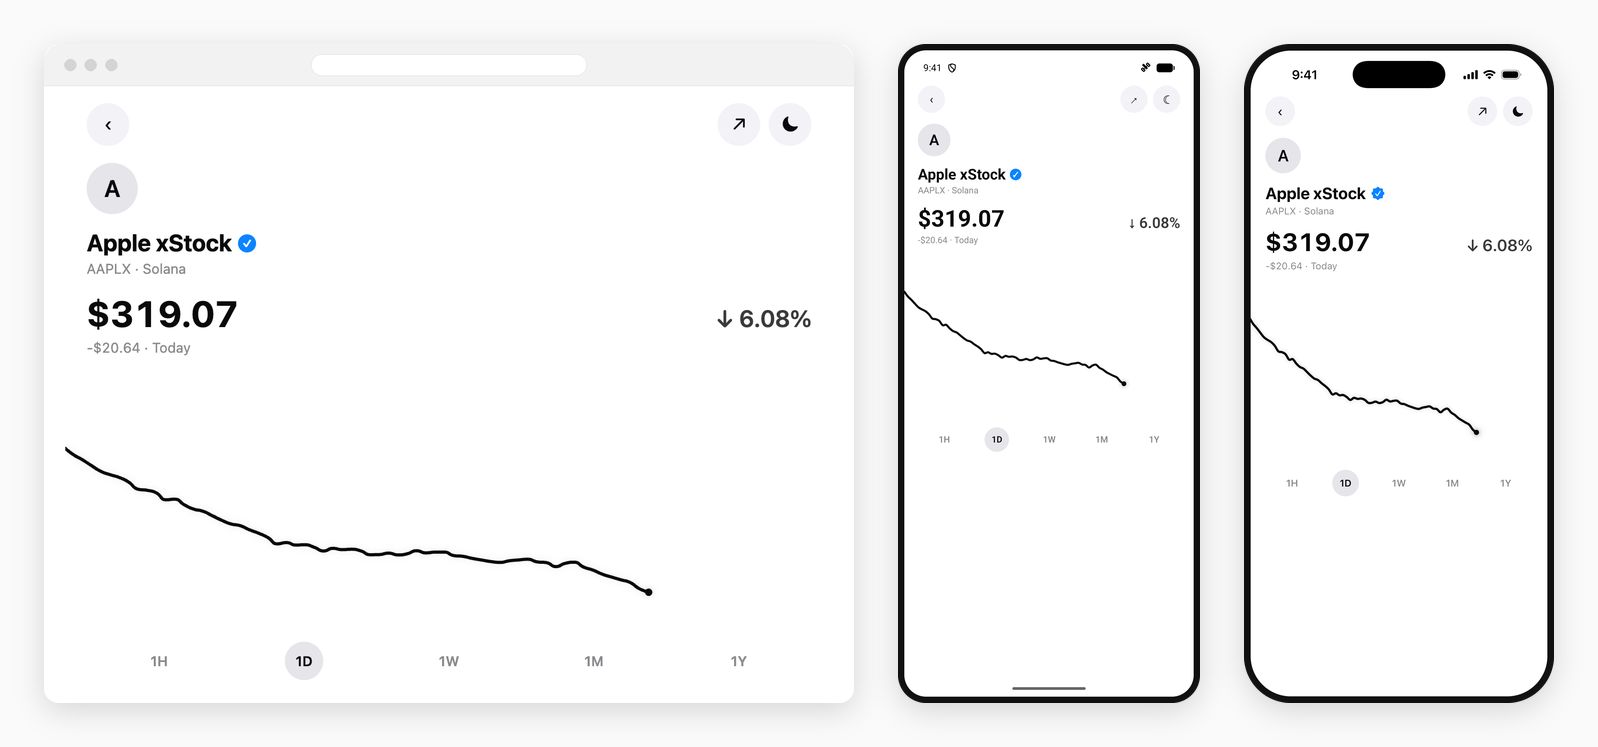
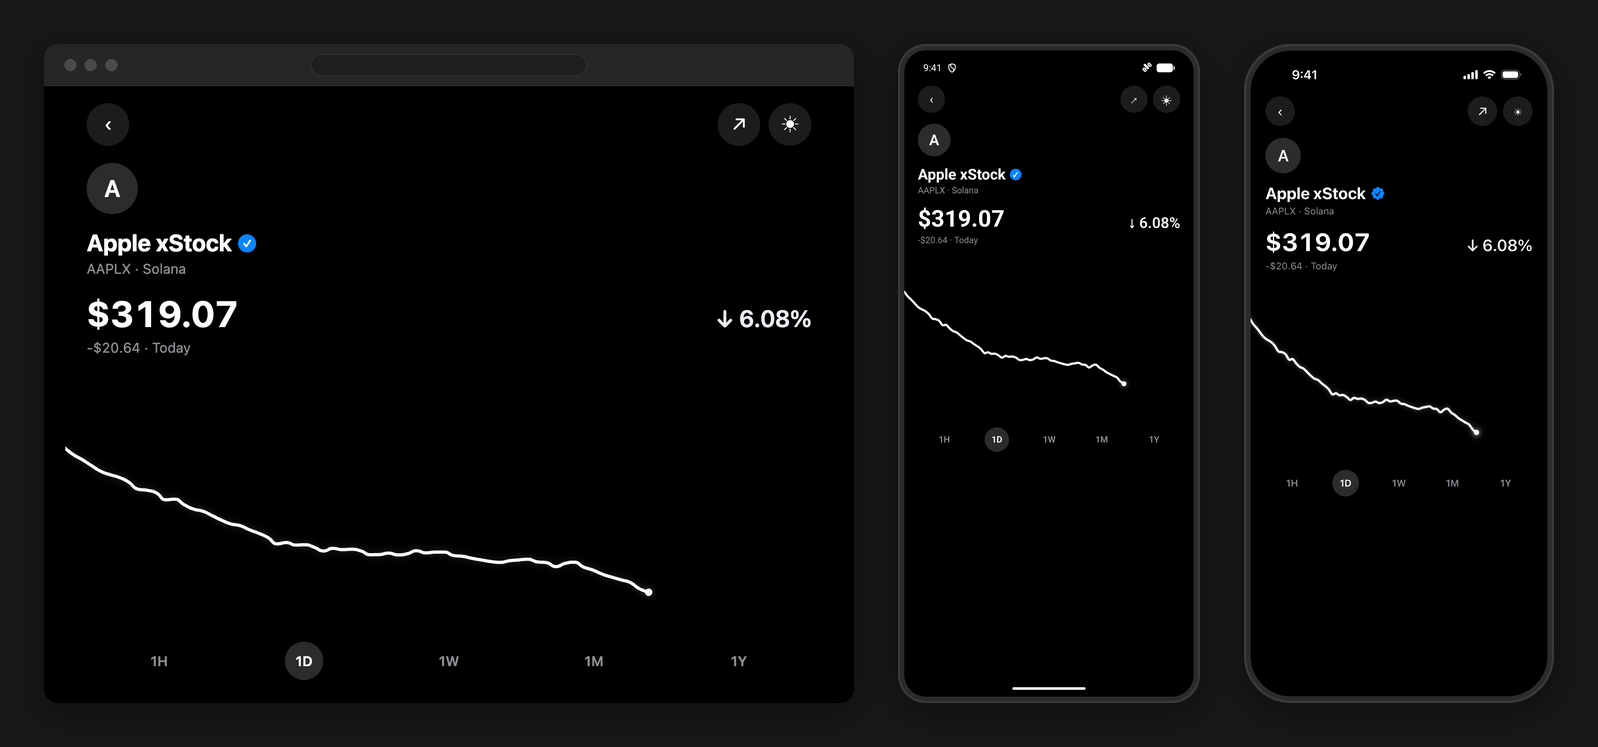
The Family-style token screen running on the web, on Android and on iOS, side by side
One trace, three renderers, in the appearance you are reading this page in — the resting wave already handed over to the window it morphed into.

The wave that becomes the price

While the price is loading the plot is not a skeleton but the same chart with other values: a resting curve laid in the window's own domain. When the data lands the marks are interpolated to it, so nothing unmounts and nothing is swapped — which is also the only way to do it on a device, because a custom skeleton is a web-only prop. isLoading stays false throughout for the same reason: the chart's own placeholder is the thing being replaced.

tsx
const arrival = animation({
  // What 'morph' interpolates over: the wave's values towards the window's.
  duration: 360,
  easing: 'ease-in-out',
  reveal: reveal.draw({ duration: 620, easing: 'ease-in-out' }),
  transition: 'morph',
  updates: true,
})

// The wave is the placeholder, so the chart is never told it is loading.
const values = isLoading ? waveValues(domain) : range.values

<Chart.Line animation={arrival} isLoading={false} series={[series({ id: 'price', values })]} />
The domain is the trick. The wave is built inside the price window's own yAxis.domain, not in a range of its own. A placeholder drawn somewhere else has to travel as well as change shape, and a curve that slides up the plot on arrival reads as the chart moving rather than as the numbers landing.

A step back with a beat

Everything the finger drags is drawn by whoever draws the line — the crosshair, the time above it, the dot at the head of the trail — because a position that crosses into JavaScript and returns as a re-render arrives after the finger has gone. What the app keeps is the price in the header, which sits still.

The rest of the trace steps back to dimOpacity over dimDuration rather than at the touch, so a finger landing reads as the lights coming down. The lighting on the reading is put down with that ramp and not with the touch: dropped when the finger lifts, the stretch of trace it was lighting would come back up with everything else, and the part that was never dimmed would flash along with the part that was.

tsx
const scrubbing = (stamps: readonly string[]) =>
  interaction({
    crosshair: 'x',
    crosshairStyle: {
      color: color.crosshair,
      // A chip rather than bare text: a background is what turns the label into one.
      labelBackground: color.pillActive,
      labelColor: color.textMuted,
      labelPadding: { x: 12, y: 5 },
      // One stamp per reading, in data order. The last one says LIVE.
      labels: stamps,
      width: 1,
    },
    // The step back takes a beat in both directions instead of cutting.
    dimDuration: 420,
    dimOpacity: 0.34,
    haptics: true,
    hover: 'nearest',
    // dot: true puts the reading's own dot at the head of the lit stretch.
    marker: marker.trail({ color: color.trace, dot: true, size: 11 }),
    // The web draws a tooltip unless told not to, and the header is the readout.
    tooltip: false,
  })

What it uses

PropTypeDefaultDescription
Chart.Linefeature-charts/family-chart.tsxThe price trace: full-bleed with both axes hidden, a pulsing point on the latest reading, and room kept at the end for it on the two windows that close on now.
animation({transition: 'morph'})feature-charts/family-chart-style.tsInterpolates the resting wave into the window that lands, so the arrival is one curve changing shape rather than a placeholder being replaced.
interaction.dimDurationfeature-charts/family-chart-style.tsHow long the marks take to step back for a reading, and to come back up when it ends. The lit stretch of trace is held until that ramp is finished.
marker.trail({dot: true})feature-charts/family-chart-style.tsLights the trace up to the reading, with the dot on the reading drawn by the chart rather than fed back through annotations, so it keeps up with the finger.
crosshairStyle.labelsfeature-charts/family-chart-style.tsThe time above the crosshair as a chip: one stamp per slot, a background and padding around the one being read, placed by whoever draws the line.
annotation.point({pulse})feature-charts/family-chart-style.tsThe live dot and its bloom, stepped back while a reading is in progress through scrubOpacity so the finger has the plot to itself.
useChartScrub · useLastReadingapps/example/use-family-readout.tsTurns the scrub into the price, the delta and the percentage above the plot, and finds the last reading the window actually has for the live dot to sit on.
Platform filesfamily.ios.tsx · family.android.tsxOne screen per platform: SwiftUI through @expo/ui on iOS, Compose on Android, React Native on the web — sharing the data, the theme and the chart.

Split the way the other two studies are: the chart, its style, the theme and the generated prices are the shared packages/feature-charts package, and the screen around it — in the example app — is one file per platform. apps/example runs it on a device with yarn ios:example or yarn android:example.

A study, not a product. The screen is built to test the library against a design people already know by heart. It uses generated data, and it is not affiliated with or endorsed by Family.